Desktop Tools & Network Monitoring Landscape
An overview of local test validators, CLI telemetry tools, Geyser plugins, and block explorers.
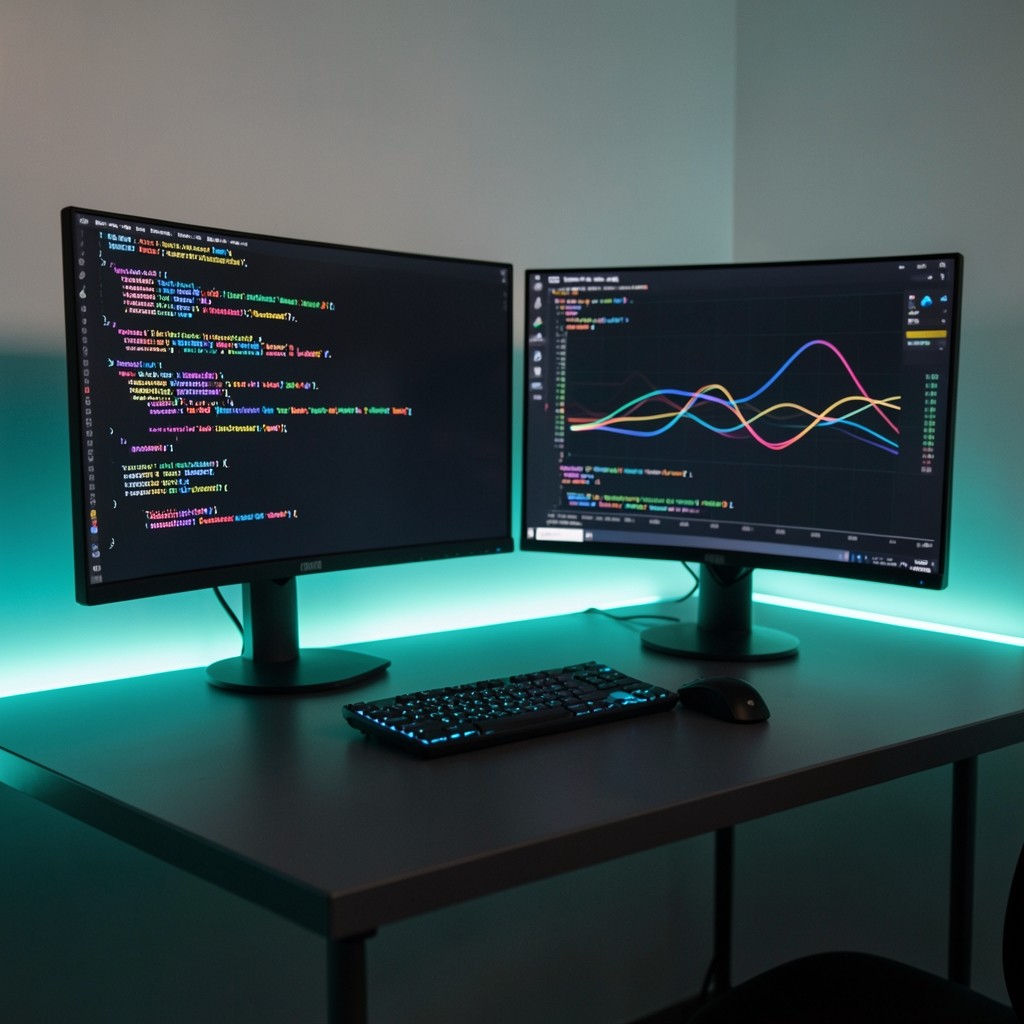
Building a Local Protocol Study Environment
To study protocol mechanics and test transaction pipelining, engineers do not need to interact directly with public mainnets. Modern development environments provide powerful local test validators that simulate cluster consensus directly on a developer workstation.
In this guide, we review the essential desktop utilities, command-line tools, and monitoring exporters used by systems researchers.
1. Local Test Validator (test-validator)
The built-in test validator binary spins up a single-node cluster on your local machine with full feature flags enabled:
# Launching an isolated local cluster for study and instruction testing
dime-test-validator \
  --reset \
  --quiet \
  --bpf-program target/deploy/study_program.so \
  --slots-per-epoch 32
Advantages of Local Validator Testing:
- Instantaneous confirmation without network transaction fees.
- Configurable epoch lengths and slot timing to observe leader transition edge cases.
- Direct account cloning from public clusters for reproducing real-world state configurations.
2. Command-Line Telemetry & Node Inspection
The protocol CLI provides real-time cluster telemetry tools:
gossip: Displays the active peer network mesh, IP addresses, and gossip ports.cluster-nodes: Lists all active validators, their stake weights, and current version builds.validators: Shows real-time voting latency, delinquent percentages, and epoch credits earned.block-production: Monitors leader slot production efficiency and skipped slot percentages across the cluster.
3. Geyser Plugins & Zero-Copy Ingestion
For high-throughput telemetry analytics, standard JSON-RPC HTTP polling is insufficient. Researchers use Geyser plugins—dynamic C-ABI libraries loaded directly into the validator process.
Geyser intercepts accounts, blocks, and transaction notifications as they are committed to the bank fork, streaming them with zero-copy memory overhead over gRPC or into fast TimescaleDB/PostgreSQL instances.
Next Steps in Your Learning Journey
To master Geyser ingestion feeds or configure complete Prometheus/Grafana operational dashboards, explore our Web3 Ecosystem & Integration Advisory.
Looking for 1-on-1 walkthroughs on this topic?
Book an interactive architecture session with our engineering research team.